In speed optimization to determine our client’s website speed, we often use WebPageTest. There are other tools available for measuring the speed of a website, but this one we use for determining the duration and better waterfall understanding.
Today we want to dive into how to better use and understand the data from the popular website speed test tool WebPageTest.
WHAT IS WEBPAGETEST?
WebPageTest is one of the most popular and free tools for measuring website’s speed performance. In WebPageTest you can see web performance tests on your site from a number of different locations across the world in a number of different browsers in a number of different devices.
It enables several options. There are Advance Testing and Simple Testing. In advance testing, you can measure the website’s speed performance with so many features that you won’t find in other speed analysis tools around the internet.
WHY CHOOSE WEBPAGETEST?
This is a very question as a speed optimization expert. As I told you earlier There are some features in this tool what available in other tools. One of the main reason is it runs three tests by these three tests and provide you with a summary with three tests, by that you can determine how your caching is working. Another reason is its waterfall analysis model is pretty good rather than Pingdom and gtmetrix.
It also provides several screen shots of your website according to google’s page speed tool (lighthouse). So then you can get the image of your website in seconds by seconds.
RUNNING A TEST IN WEBPAGETEST
To run a test in WebPageTest there are two options. Such as:
- Advanced Testing
- Simple Testing
Advanced Testing
Honestly there are too many options in Advanced Testing to cover. This section of this tool is structured powerfully for the developers. But there is simple testing for beginner.
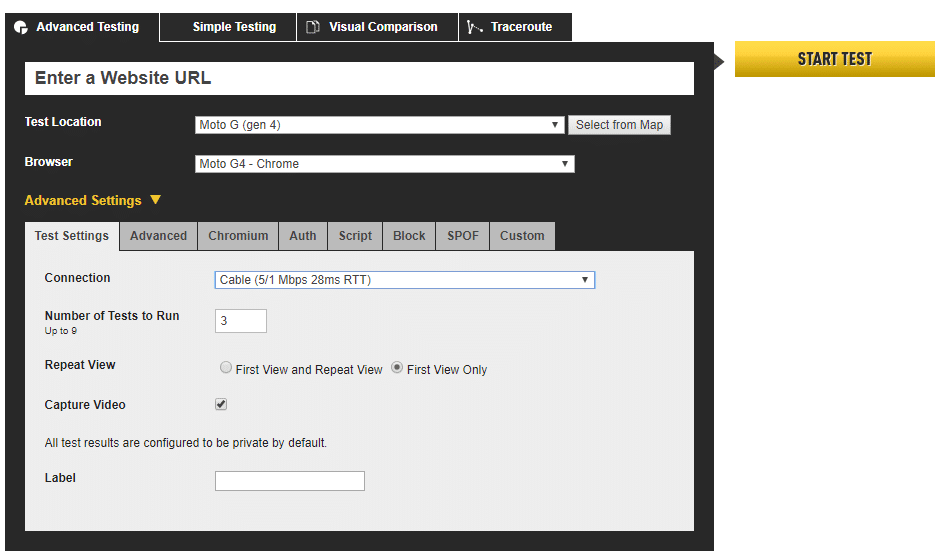
At the very beginning, there are so many locations to choose with a variety of devices with different types of browsers.
If you want, you can select your location from the map. Once you have picked your location, you can select which browser you would like to use for the test, and in the Advanced Settings, you can choose the connection speed.
You can run up to 9 consecutive tests. You can check the first view or for the repeat views. Also, you can capture video of your website loading. There are a bunch of features available for the developers to customize their tests.
To run test in Advanced Testing you need:
- Your website URL
- Test Location.
- Select A Browser.
- Connection.
- Keep Test Private.
- Capture Video.
- Click Start Test.
Simple Testing
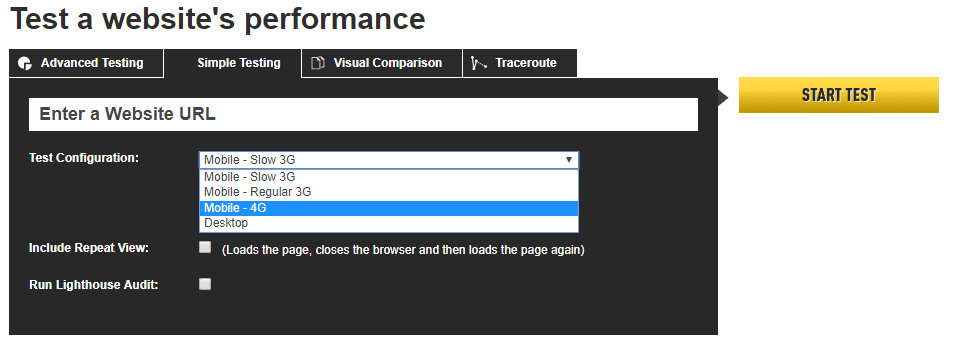
The simple Testing interface is a pretty simple interface. You can select whether the test configuration with Desktop or mobile using Slow 3G, Regular 3G, or 4G. Also, You can select a repeat view of the site, and run a Lighthouse audit.
THE SPEED TEST RESULTS
WebPageTest’s result is breakdown into 9 sections. But we don’t need each of the sections. Though we will understand the definition of each section for a better understanding of this tool. So the sections are:
- Summary.
- Details.
- Performance Review.
- Content Break down.
- Domains.
- Processing Break Down.
- Screen Shot.
- Image Analysis.
- Request Map.
Summary
When the test has completed, WebPageTest will show a Results Summary. WebPageTest displays a custom set of speed optimizations recommendation and each of those grades from F to A. You can click each of the recommendations and read in details.

As you can see in the screenshot there are six-speed optimizations recommendations with grades. As you understand each grade means the current situation of your website loading speed is either good or bad in each recommendation.
The recommendations are:
- First Byte Time – the time it takes for the server to respond to a client according to the page.
- Keep Alive Enabled – it is a communication between the web server and the web browser that says “you can grab more than just one file at a time”.
- Compress Transfer – this is basically gzip compressor.
- Compress Images – it is actually a summary grade that shows how many Images are optimized.
- Cache Static Content – it is your website’s contents like css, js storing in the user end.
- Effective Use of CDN – if you are using CDN then it will reflect here as grade “A”.
Under the initial summary area there is a Performance Results. In performance Results you can see bunch of informations according to your load speed.

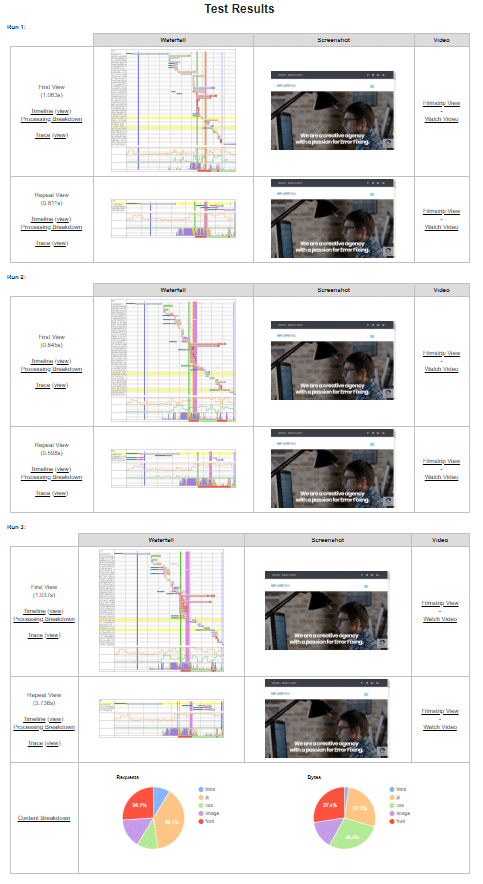
Below the Performance Results there are remaining summaries of test results in a clunky interface. There is a table that shows waterfall, Screen Shot and Video across the top for the first view, and below that, the same information for the repeat view.
Details
In the details tab there is Waterfall View, Connection View and Request Details.
Waterfall View
Waterfall View actually the presentation of load time and stuck time of your resources in a chronical structure.
It provides several colors with time. And different colors has different meaning.
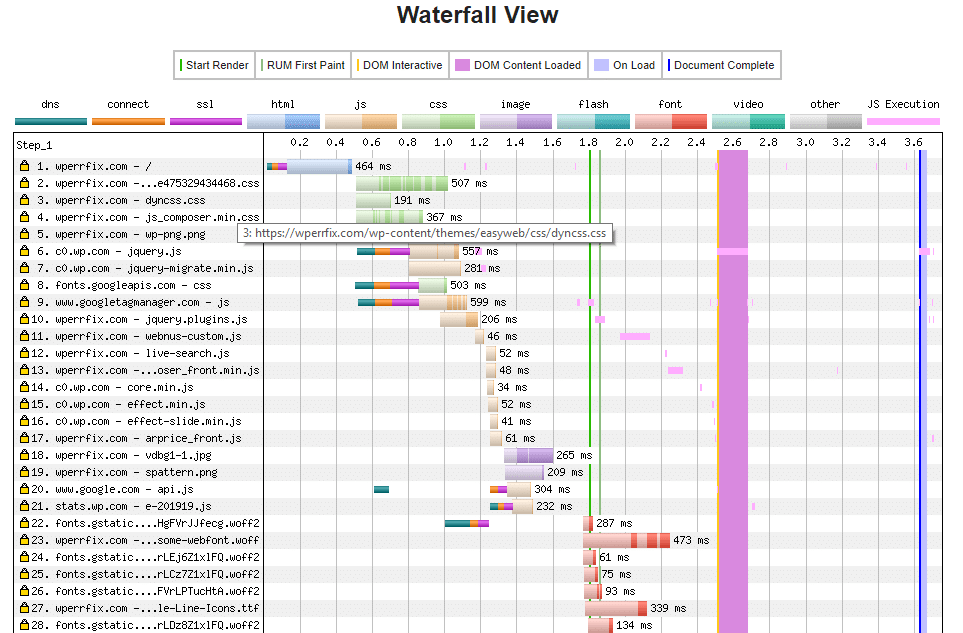
Basically the waterfall is a cascading chart of each resource loaded by a browser – and in a nutshell the shorter the horizontal lines are the better!
The Colors meanings
As you can see in the image below everything is colour coded and every colour has a significance.

The colours that appear above the actual waterfall – blue, orange, green, purple, green, red and grey are all reflective of the type of content on your website.
For example, if you see a red line in a row – you will know that is a font file is loaded if you see green – then you know it is a CSS file that is being loaded.
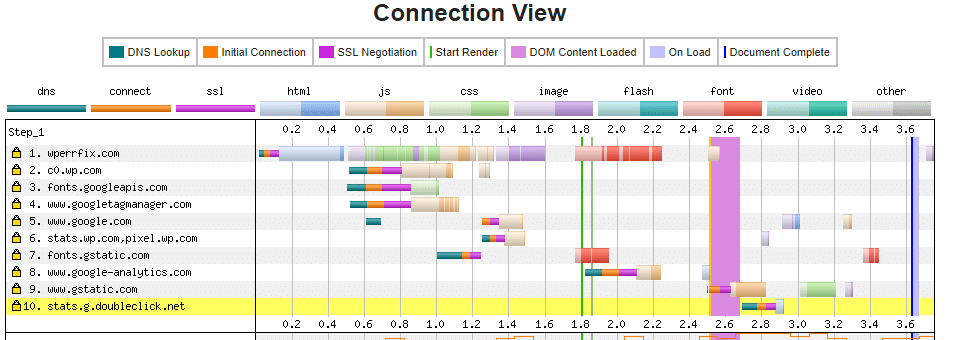
Connection View
The Connection View is similar to the waterfall view. It shows the contents load from all other sources.
Request Details
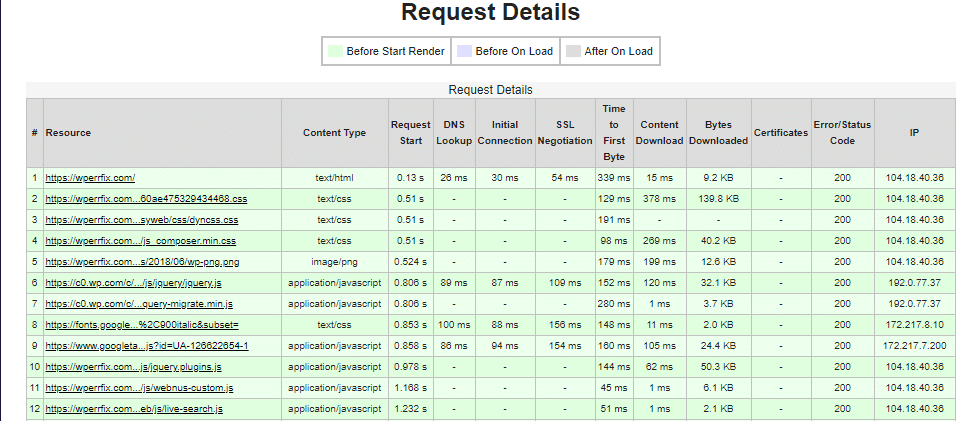
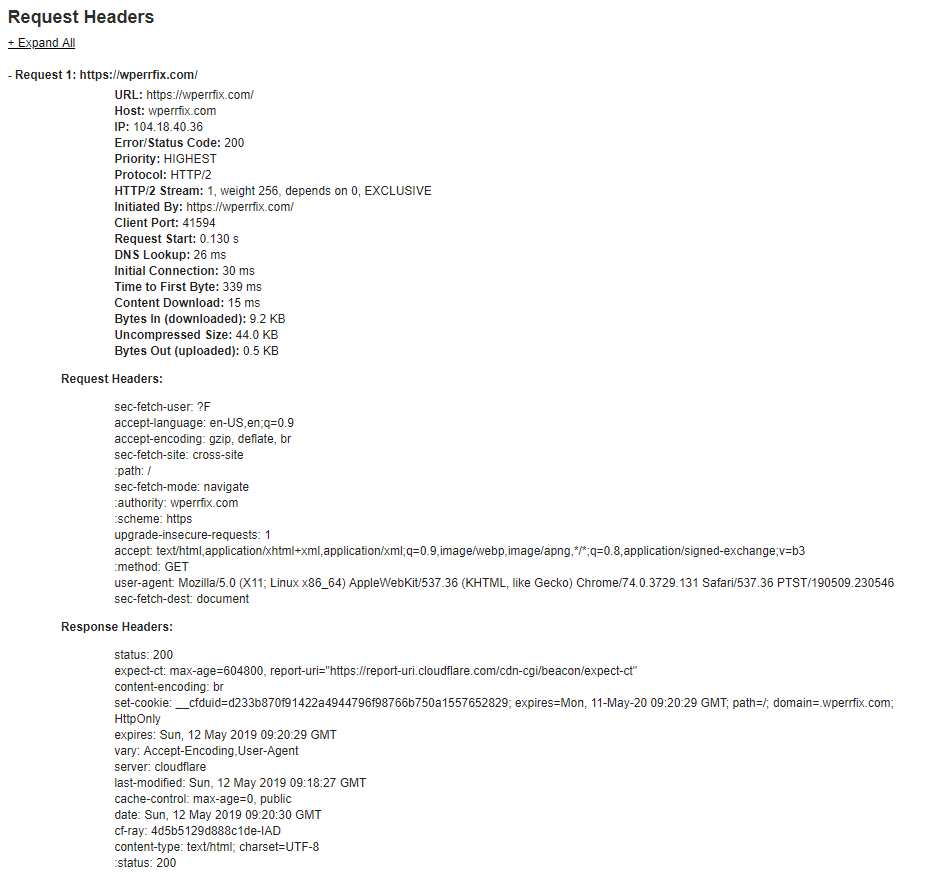
The Request Details section provides details of every request, and if you click on a particular one, you will be taken to the corresponding expanded entry in the Request Headers section.
Performance Review
The Performance Review tab demonstrates the page requests, set a Full Optimization Checklist. This covers the 6 recommendations WebPageTest has tested for.

Below there is the Details section, showing the scores of each of the six sections. And the scores are graded from 0-100. So as you understand if your score in each test is 100 it is perfect!!
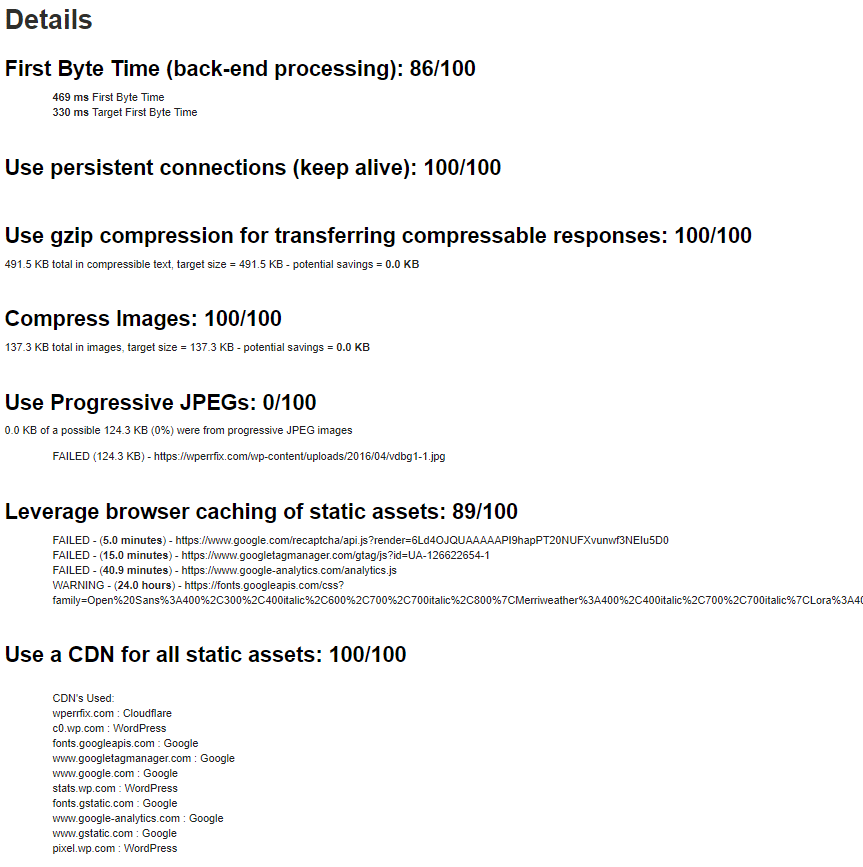
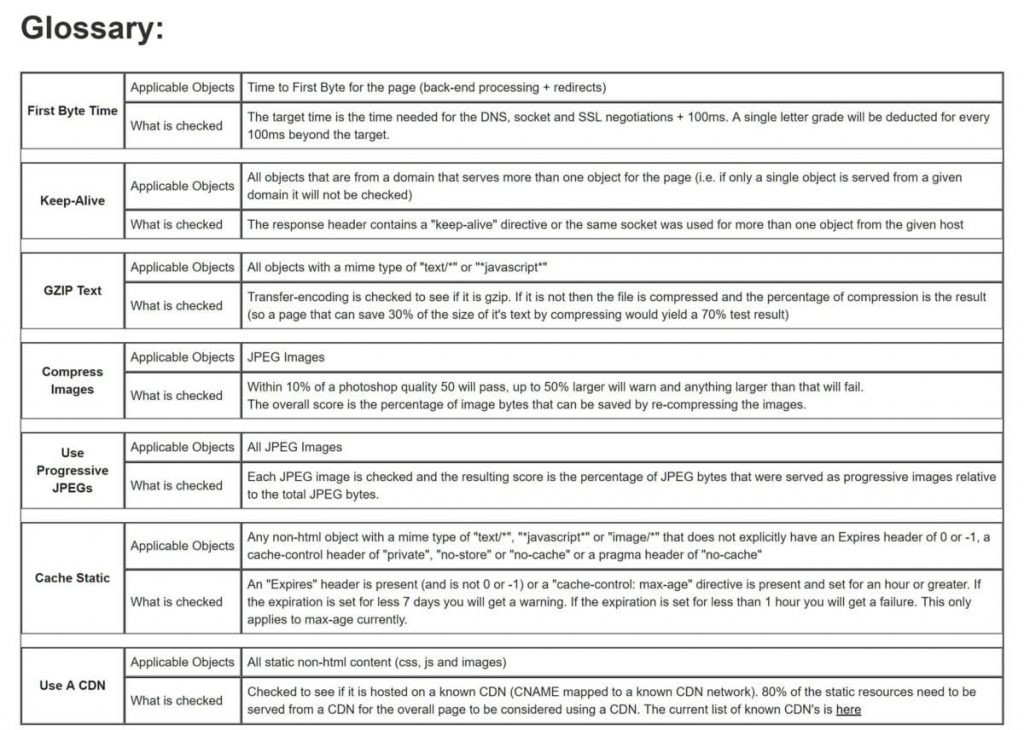
After Details section there is the Glossary section. It explains six tests, what objects are applicable for each test, and what is checked.
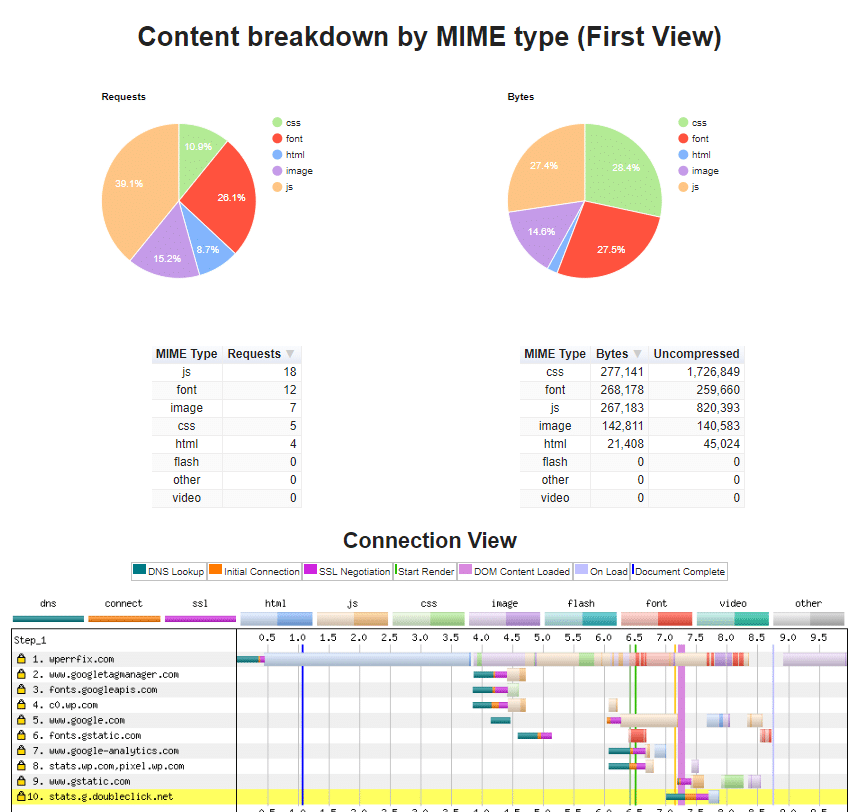
Content Breakdown
Content Breakdown is a very informative tab. In this tab, it shows each file type with bytes using in your website. It provides a chart where it shows files and bytes contents using specific colours.
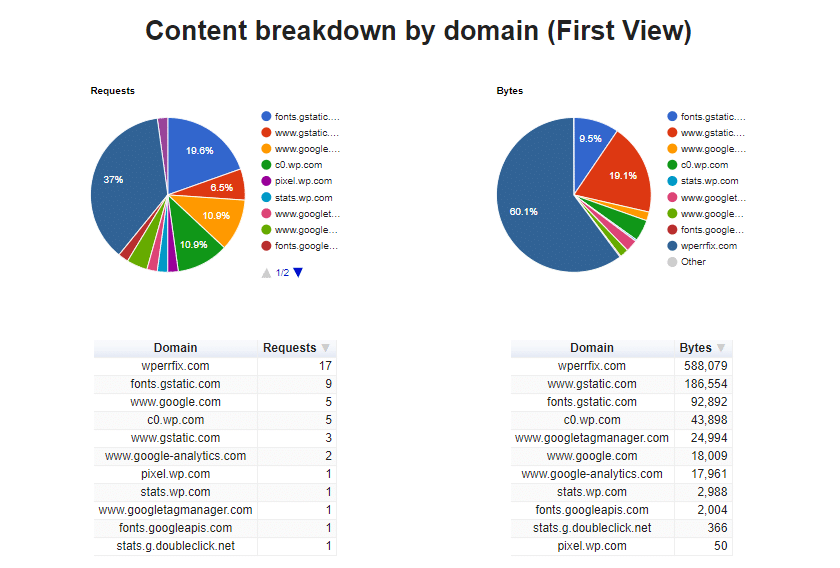
Domains
This tab is similar of content breakdown. It only displays the assets or files coming in your website from other sources.
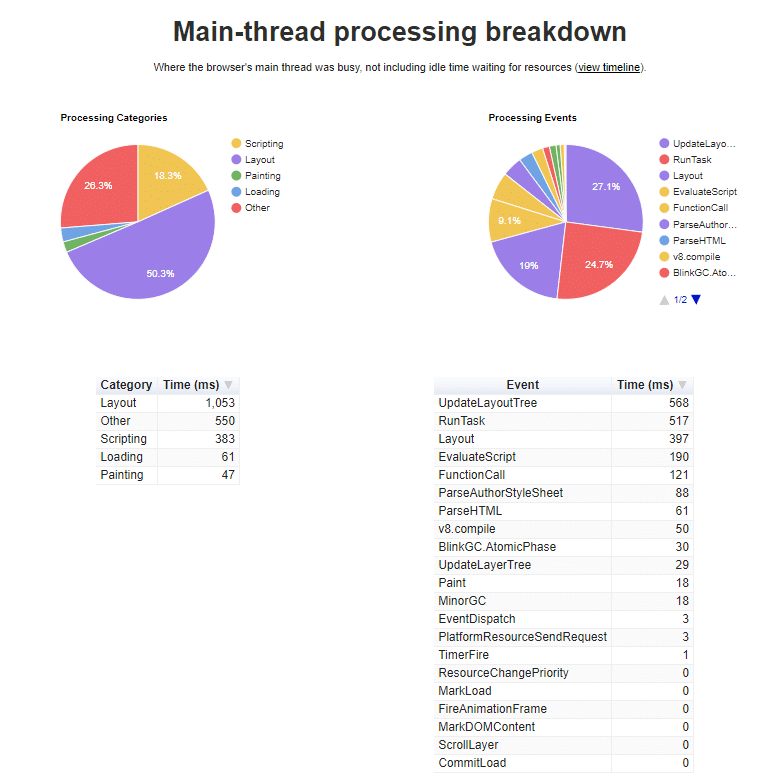
Processing Breakdown
Processing Breakdown displays verious processing categories and processing events. Such as JS, Server-side programming and etc.
Screen Shot
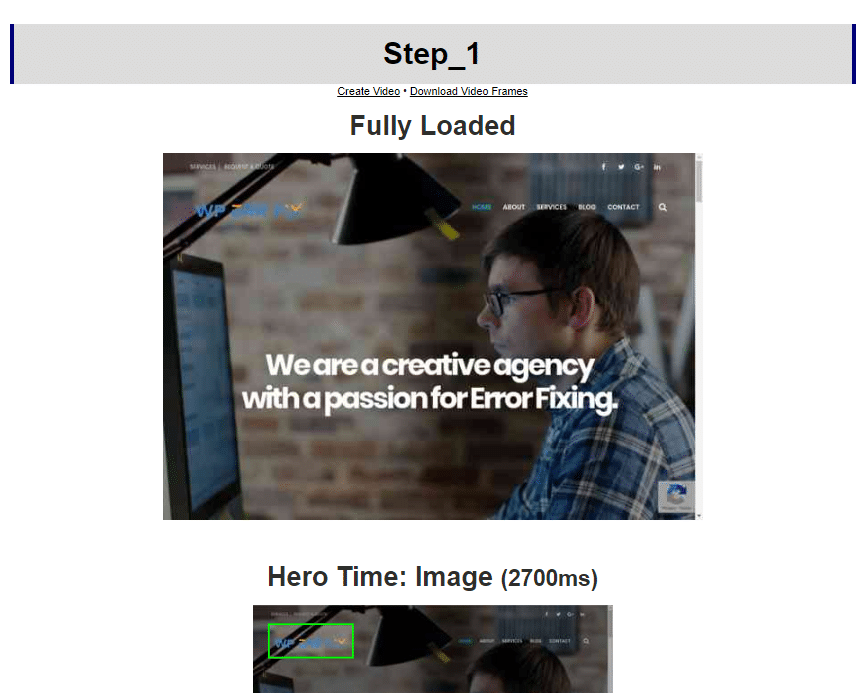
Screen Shot tab displays the screen shot of your website when it is fully loaded with time and there is an options for creating video how your website is loading.
Conclusion
WebPageTest highly recommending a speed analysis tool for speed optimization. With its unique toolset for developers and advanced users, it can be easily measured your website’s loading time or your website’s speed factors.


